Flammable and Combustible Materials
The material in this article is extracted from Chapter 1 of the 2nd edition of the book Plant Design and Operations and in the ebook 52 Process Safety Moments.
A hazard that is of great concern to virtually all process facilities is fire — most of the materials being processed, stored or transported are flammable and/or explosive. Therefore, when designing a process facility, the prevention and control of fire are of the utmost importance. The terminology to do with flammable materials can be confusing. An overview is provided below.
Fire Triangle
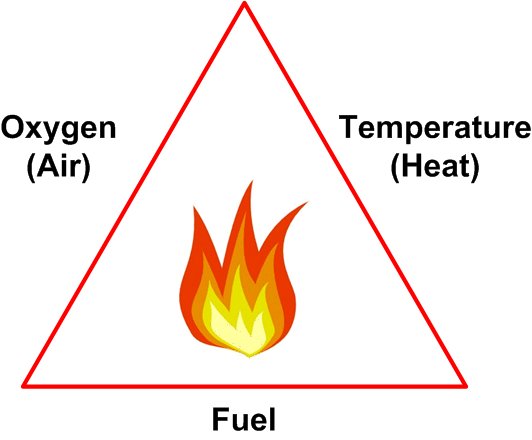
Fires require the presence of fuel, air (oxygen) and a source of ignition. These three criteria are often referred to as the fire triangle — shown in Figure 1.
Figure 1
Fire Triangle

In order for a sustainable fire to develop it should be noted that,
- The fuel has to be in the form of a vapor (liquids and solids do not burn directly — the fire generates flammable vapors at their surface and it is those vapors that actually burn).
- The word ‘oxygen’ covers not only the oxygen present in air (21% concentration) but also oxidizing materials such as chlorine and nitrates.
- The word ‘Heat’ is somewhat misleading — heat, in and of itself, will not start a fire. What is actually needed is a source of high temperature such as a spark from an electric motor or the flame in a fired heater.
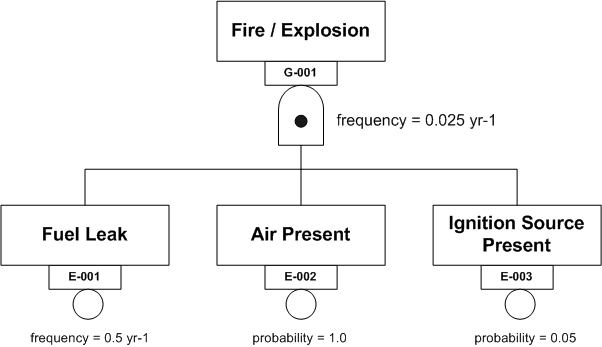
Figure 2 shows a fire triangle in the form of a Fault Tree AND Gate.
Figure 2
Fire Triangle AND Gate

In words, IF there is a fuel leak and air (oxygen) is present AND an ignition source is present THEN a fire or explosion will occur. The frequency with which such an event is expected to occur is obtained by multiplying the frequency of the initiating event (the fuel leak) by the probabilities of the contingent events (air present and ignition source present). This gives a value of 0.025 yr-1. In other words a fire at this location is expected to occur once every 40 years.
In some processes and equipment air is routinely allowed to contact hydrocarbons. Examples include some treating processes in refineries and many atmospheric fixed roof tanks. In such situations, the potential for a fire can be controlled by eliminating any ignition sources, maintaining a hydrocarbon/oxygen mix that is outside the flammable range, and installing equipment such as flame arrestors to prevent flame propagation.
Flammable Range
Not all fuel vapor/oxygen mixtures will burn — the concentrations have to lie within the flammable range, which have upper and lower limits for the concentrations of the fuel in the vapor space. The flammability limits vary according to many factors, particularly the pressure and temperature of the mixture and the presence of inert components such as steam, carbon dioxide or nitrogen.
The flammable range for a fuel is defined by the Lower Flammable Limit (LFL) and the Upper Flammable Limit (UFL). These terms are also referred to as the Upper and Lower Explosive Limits. Below the Lower Flammable Limit (LFL) there is insufficient flammable material for a fire to occur — the mixture is ‘too lean’. It is the lowest concentration of a flammable vapor in air capable of producing a fire in the presence of an ignition source. The UFL is similar to the LFL except that there is too high a concentration of flammable vapor for a fire to occur — the mixture is said to be ‘too rich’. For most flammable hydrocarbons the LFL is around 2 to 5%. For simple alkanes such as methane and ethane the UFL is in the 10 to 15% range. Some chemicals, such as hydrogen, ethylene oxide and acetylene, have much higher values for UFL.
Values for flammable limit ranges for many flammable materials are provided by NFPA 704 — Standard System for the Identification of the Hazards of Materials for Emergency Response (NFPA 2017). This standard also describes the well-known “hazard/safety diamond”.
Flash Point
The flash point of a flammable material is defined as the temperature at which a vapor that is inside its flammable range that can be ignited. An ignition source such as a flame or spark is needed to make the material actually burn. It is important to recognize that an ignition source is indeed required ― the flash point is not the same as the auto-ignition temperature. Before a flammable mixture will burn its temperature must be at or above the flashpoint. If the temperature is below this point then the vapor mixture will not burn, even if a source of ignition exists. (The word ‘flash’ is used in process plants in another context — if a liquid at high temperature has its pressure suddenly reduced then it will ‘flash’ or boil. This has nothing to do with it igniting.)
The flash point is determined by heating the liquid in test equipment and measuring the temperature at which ignition will occur when a small flame is introduced in the vapor zone above the surface of the liquid.
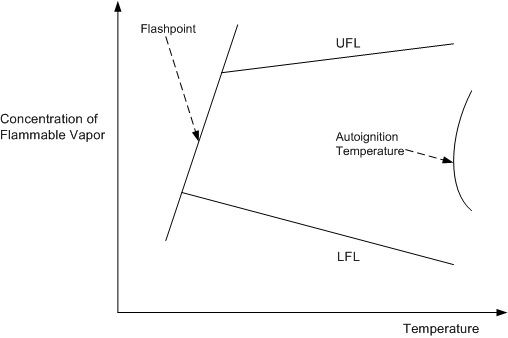
Figure 3 illustrates the concepts of ignition temperatures and flashpoints and flammable limits.
Figure 3
Flammability and Ignition Limits

The left line in Figure 3 is the flashpoint line. If the mixture has a concentration and temperature that puts it to the left of the line then it will not burn, even when a source of ignition is present. Similarly, mixtures above and below the LFL/UFL values will not burn
Even if the material is above its flashpoint, the ignition source must be of sufficiently high temperature and must contain sufficient energy to ignite the fuel. This minimum energy value varies with type of gas and concentration; for hydrocarbon vapors it is low, for high flash point liquids, such as diesel and fuel oil, it is much higher — usually in the form of an existing fire. This is why low energy flashes (such as might be created by a mobile phone or a digital camera) may not ignite a flammable mixture.
If a flammable mixture is heated to a high enough temperature it will spontaneously ignite; an ignition source such as a flame or spark is not needed. Spontaneous ignition occurs at the auto-ignition temperature (AIT), which is also shown in Figure 3.
Copyright © Ian Sutton. 2020. All Rights Reserved.
